LMI Researchers Build Dashboards Analyzing State Certifications and Licenses Data
This article is part of a series of reports on new estimates from the Labor Market Information Institute State Certification and Licenses Data Tables. Find previous blog posts in this series here.
On October 15th, 2020 at 1:00 PM EST, the Labor Market Information (LMI) Institute will hold a virtual seminar to explore applications for State Certifications and Licenses data using Tableau software. In this seminar, FREE to LMI Institute Members (REGISTER HERE), participants can learn how Tableau helps LMI researchers visualize and disseminate the attainment of state level certifications and licenses, and their associated earnings, by age, race and/or ethnicity, gender, industry, and occupation.
State Certifications and Licenses estimates enable labor market researchers to identify the industries and occupations in which certification and licensing is most prevalent and most impactful on workers’ earnings. States can use these data to benchmark the attainment of certifications and licenses, in addition to degrees, for key occupations and sub-populations against other states, their region, and the nation. Researchers can additionally use these data to identify the industries and occupations in which certification and/or license attainment most increase the earnings of workers and design training programs to upskill workers in these fields.
Certifications are awards issued by a non-government body that convey the competency to perform a specific job. Examples of certifications include COMPTIA’s Sec + and PMI’s Project Management Professional certifications. Licenses are awards issued by a state or federal government body that convey legal authority to perform an occupation or trade. Examples of licenses include Commercial Driver’s License and Teaching Certificates. Through investigation of State Certifications and Licenses data, researchers can drive further research into key professional credentials that can increase the employability and earnings of workers.
During the October 15th Seminar, researchers from across the US will convene to learn how to create interactive Tableau dashboards that allow their customers to identify key trends in certification and license attainment and associated earnings. Attendees will learn from fellow LMI researchers how to best prepare, analyze, and visualize State Certifications and Licenses data through the recreation of a State Factsheet developed by the LMI Institute. Additionally, attendees will learn how to embed the Tableau dashboard created in the seminar onto their website.
Register HERE to attend this seminar (FREE for LMI Institute Members). Note, this training is only available to LMI Institute members – to become a member or learn more, check out the LMI Institute Members Benefits or contact Marty Romitti at mromitti@crec.net.
If there are any specific topics you’d like to cover during the training, please contact the Trainer, Lee Winkler, at lwinkler@crec.net. The LMI Institute, in partnership with the Center for Regional Economic Competitiveness, has additionally developed a FREE Tableau Basic course for participants who would like to attend but are unfamiliar with Tableau software.
Participants in the training will learn how to re-create the below State Factsheet:
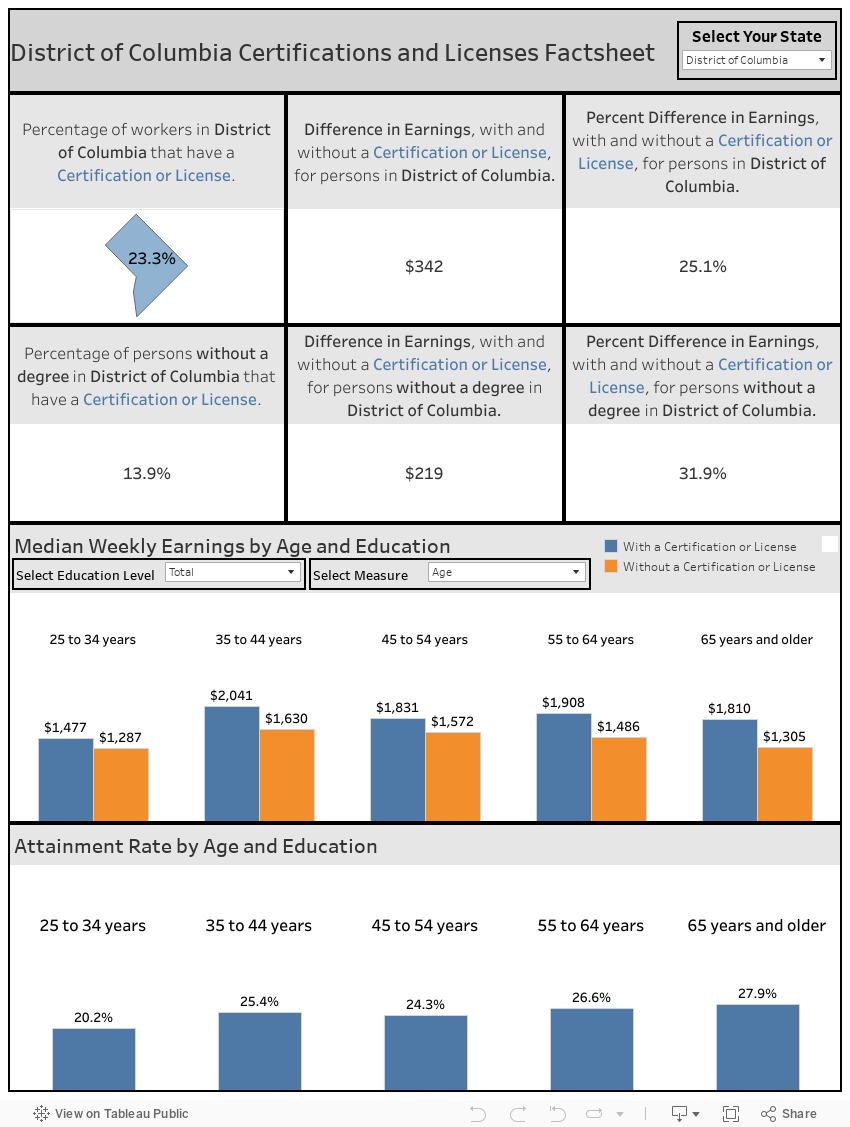
The Bureau of Labor Statistics’ (BLS) Current Population Survey collects information on the prevalence of certifications and licenses in the United States, published annually. Using this data, the Labor Market Information (LMI) Institute produced state-level estimates on the prevalence of certifications and licenses, including tables comparing certification and licensure by educational attainment across occupations, age, race and ethnicity, and gender.
[1] All data with less than 30 observations has been suppressed from the data. Observations for earnings are generally lower than for attainment and are generally lowest at lower levels of education.