2026 PMP Summit Recap
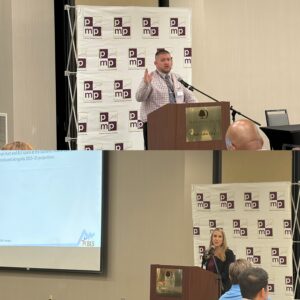
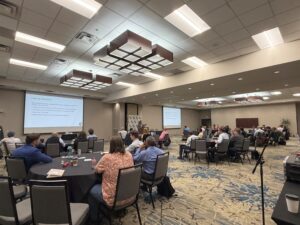
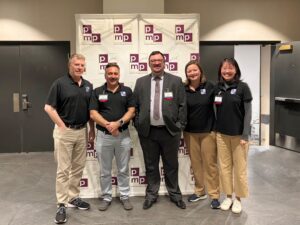
Over 50 state projections analysts gathered in Salt Lake City for the 2026 PMP Summit from September 22 to 24. The annual Summit brings together state projectionists from across the country and federal partners to exchange ideas, share best practices, and learn from each other.
This year’s sessions covered a range of topics, including updates from BLS and the National Projections team, software updates from the Utah technical team, R-based projections workflows, and the use of projections data in policy and planning. Across these sessions, participants shared new approaches, practical tools, and lessons learned from work taking place across states and regions.
A few highlights included:
- Long-term Industry Projections Workshop: Chap Deit (IA) and Chi Wong (NC) led Thursday’s skills-building workshop on long-term industry projections. They walked participants through the process of developing long-term industry projections and provided a live demonstration in Projections Suite. The workshop gave experienced projectionists an opportunity to share best practices and newer projectionists a chance to ask questions and learn from their peers.
- BLS Employment Projections Tables: BLS projections leads, Emily Krutsch and Sam Rinde, provided a refresher on the full suite of data tables available through the Employment Projections program and introduced the newly released AI exposure table that measures how occupations compare to one another based on their theoretical and observed exposure to AI.
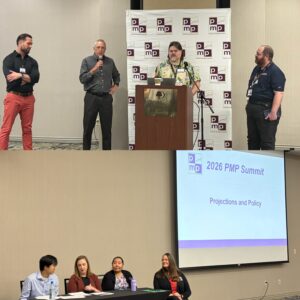
- Projections Data in Policy and Planning: Jodie Meyer (NE), Emilie Doerksen (KS), Sarah Casias (CO), and Chi Wong (NC) shared examples of how projections data have been used to inform policy and planning decisions, including determining Workforce Pell eligibility, workforce planning, postsecondary education planning, and statewide talent pipeline development.
- R-based Projections Workflows: Franklin Otis (WI) and Nathan Harbert (CA), both first-time PMP Summit presenters, shared how they use R to help streamline different parts of the projections process. Their examples included converting existing SAS code to R and smoothing historical QCEW employer data, with the latter explained through the analogy of Six Degrees of Kevin Bacon.
Thank you to the Utah team for their continued work maintaining and supporting the projections software, and to everyone who contributed to a productive few days of learning and collaboration in Salt Lake City!